Skip to Site Navigation Skip to main content

Interactive Data Visualizations

Using Power BI we have created interactive data visualizations that provide enhanced insights into the Physicians in Ontario (PIO) and Postgraduate Medical Trainees in Ontario (PMTIO) data. Users can customize their queries and compare trends over time, making it easier to understand the history and demographics of physicians and medical training in the province.

Information Box Group

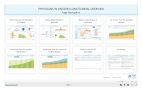
PIO: Longitudinal Data Overview Go to data visuals

Explore longitudinal trends in the distribution of active physicians in Ontario using this set of interactive data visuals.

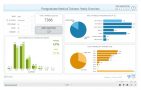
PMTIO: Longitudinal Data Overview Go to data visuals

Explore longitudinal trends in Ontario postgraduate medical education trainees using this set of interactive data visuals.